(continued from Scheduling and Emailing Reports)
Excel Reports
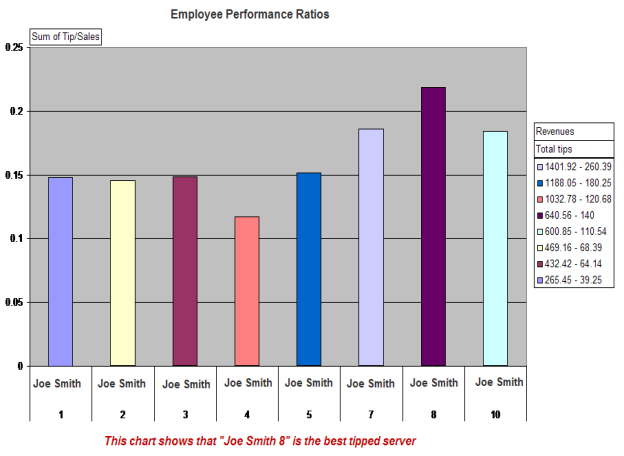
RMReports command line and file export capabilities along with Excel’s powerful auto-update features allow you to fully automate the transfer of information from Restaurant Manager to a final rendering in an Excel spreadsheet. Why would you want to do this,? The answer is simple: The “standard” reports and charts provided with any application may not always present the information in the way you might want, especially when it comes to ratios and other “derived” data. For example, you could create an excel spreadsheet that graphically shows the tip to sales ratio for your servers (a measure of customer satisfaction), or one that shows the ratio of hours worked vs. sales (a measure of productivity.) Let’s show you how.
- Decide which base report you need. In this case we will use the “Employee Timekeeping” ASI Type Report, since it contains the tip and sales information we need.
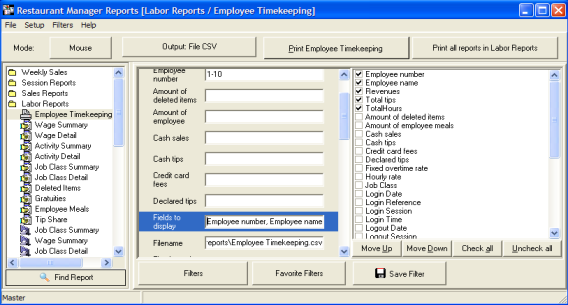
- Check the fields you wish to export. In this case we need the employee name, number, Revenues, Total Tips and Total Hours (as shown above)
- Configure the filter options. If this is a report you will be issuing on a recurring basis, you probably want to set period such as the current week or month. You might also want to limit the employees in the report to servers and other revenue producing staff only.
- Test the report by outputting to the screen.
- Select a suitable output file name. Remember, if you do not set this option the name of the report (Employee Timekeeping in this case) with a .csv suffix is assigned.
- Save the filter.
- Output report to CSV file.
- Launch Excel
- Use Excel’s “Import External Data” to import the CSV file. Select the “Delimited” and “Comma” options when prompted.
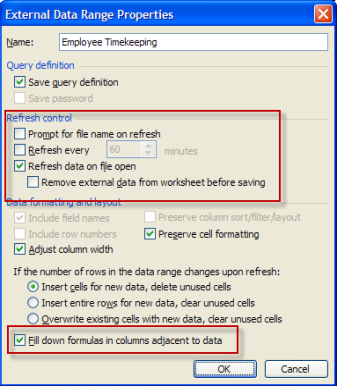
- Click on the External Data Properties icon and uncheck the “Prompt for filename on Refresh” box, and check both the “Refresh data on file open” and “Fill down formulas in columns adjacent to data.”
- Save the spreadsheet, giving it a suitable name (Employee ratios, say).
- Switch to another sheet and create a pivot table based on the imported data.
- Create “Calculated Fields” as necessary. In our case we will create calculated fields hours/Revenues and Tips/Revenues.
- Generate a chart based on the pivot table.
(continued in Running Reports from a POS Station )